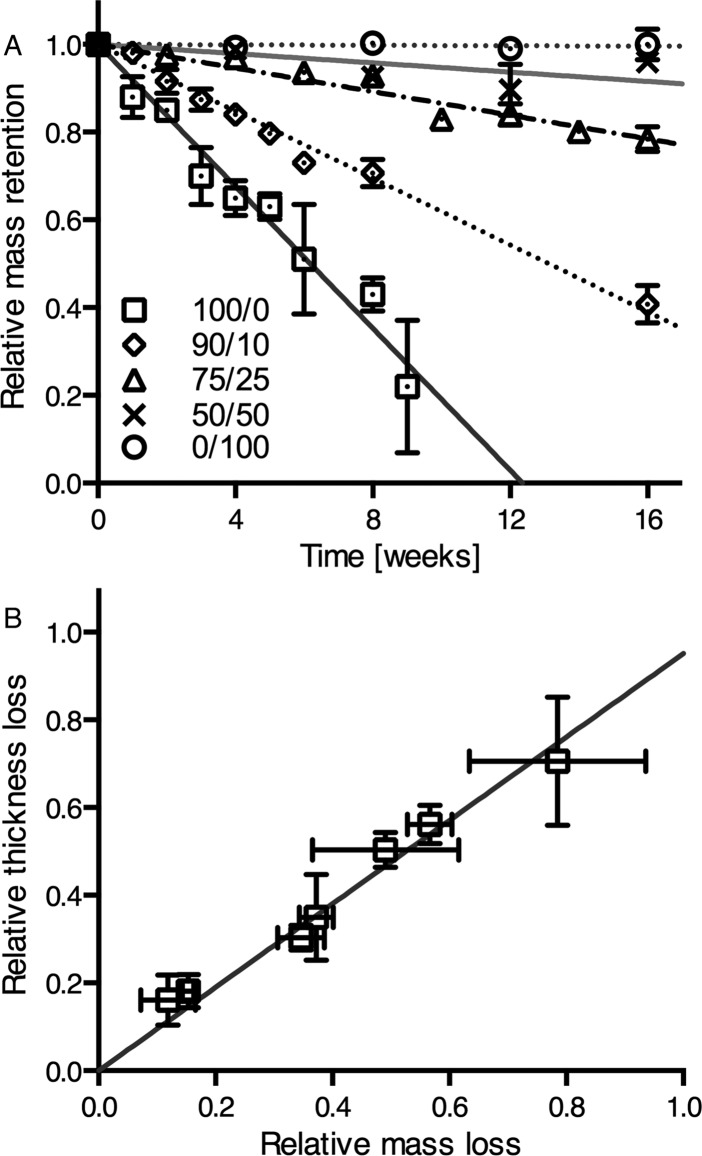
Figure 2.
(A) Relative mass retention of specimens with compositions of Ty/Hva (mol %) 100/0, 90/10, 75/25, 50/50, and 0/100 incubated in lipase solution at 37 °C (mean ± SD, n = 3). (B) Correlation between relative losses of mass and thickness of poly(tyrosol carbonate) specimens incubated in lipase solution at 37 °C. (mean ± SD, n = 3). The linear regression lines were plotted.

