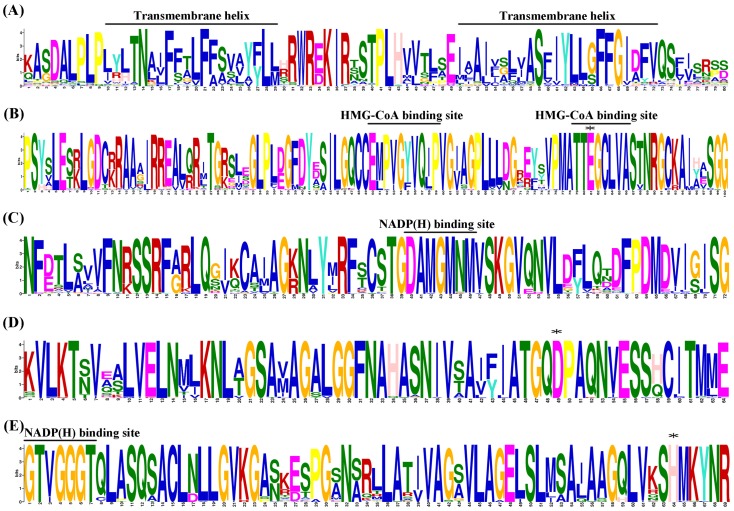
Figure 1. Sequence logos of the five motifs identified using the MEME search tool.
(A), (B), (C), (D) and (E) represent the motif 5, 3, 2, 1 and 4, respectively. The height of letter designating the amino acid residue at each position represents the degree of conservation. The numbers on the x-axis represent the residue positions in the motifs. The y-axis represents the information content measured in bits. The two transmembrane helices, two HMG-CoA binding sites (EMPVGYVQIP and TTEGCLVA) and two NADP(H) binding sites (DAMGMNM and GTVGGGT) are represented on the top of the corresponding locations in motifs. Asterisks (*) indicate the conserved residues in the catalytic domain of plant HMGR genes.

