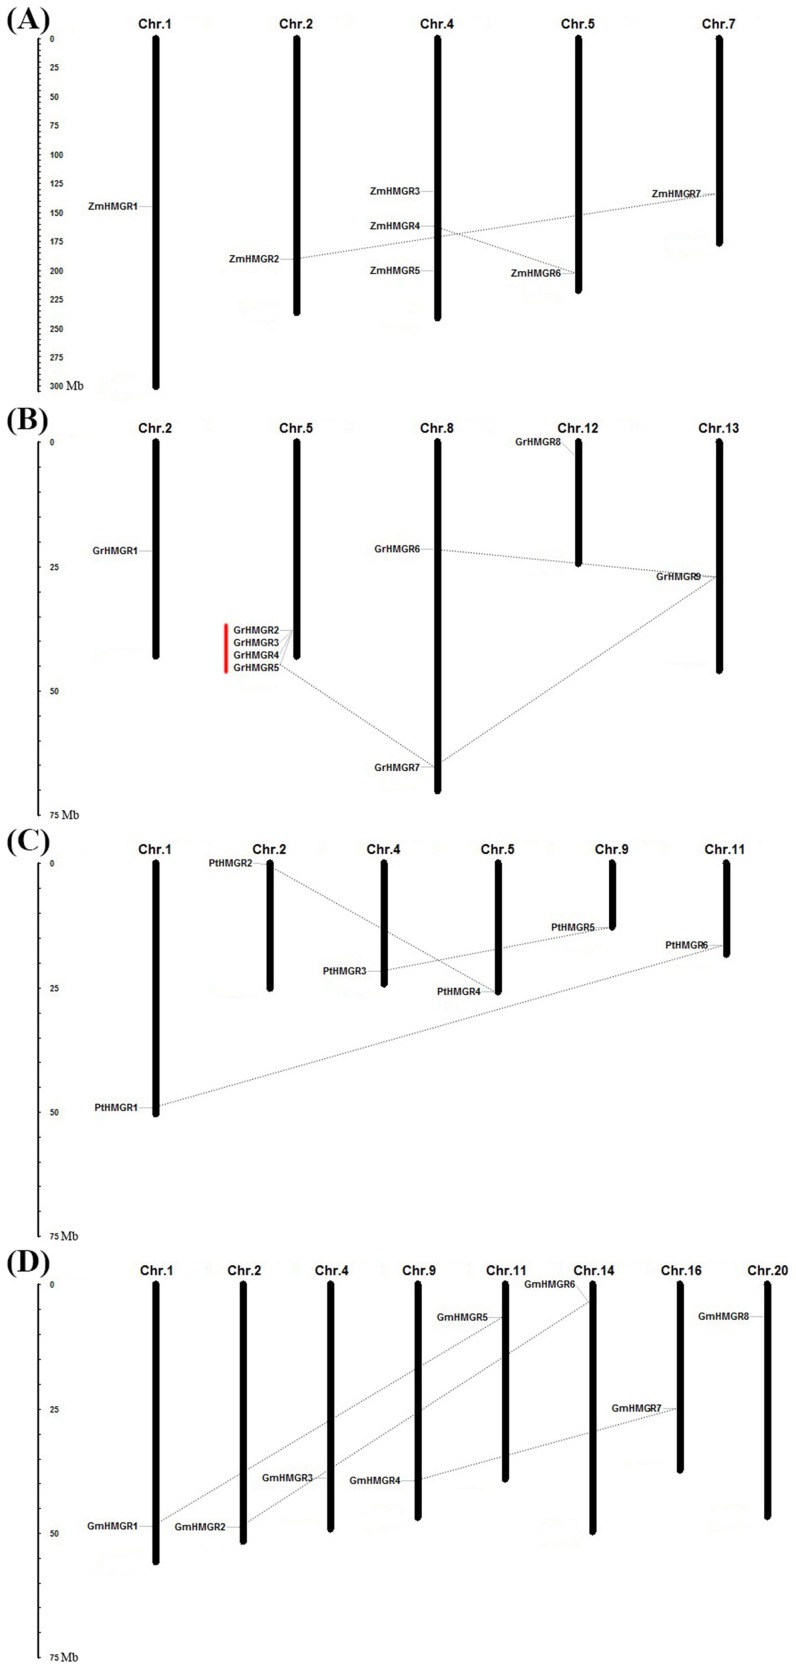
Figure 3. Chromosomal localization of HMGR genes in four selected plant species.
(A): Zea mays; (B): Gossypium raimoddii; (C): Populus trichocarpa; and (D): Glycine max. The chromosome number is indicated at the top of each chromosome representation. The scale represents megabases (Mb). The segmental duplicated genes are indicated by dotted lines and the tandemly duplicated genes by red vertical lines.

