
Figure 2. Prevalence of TDRM in patients diagnosed from 2002 through 2007.
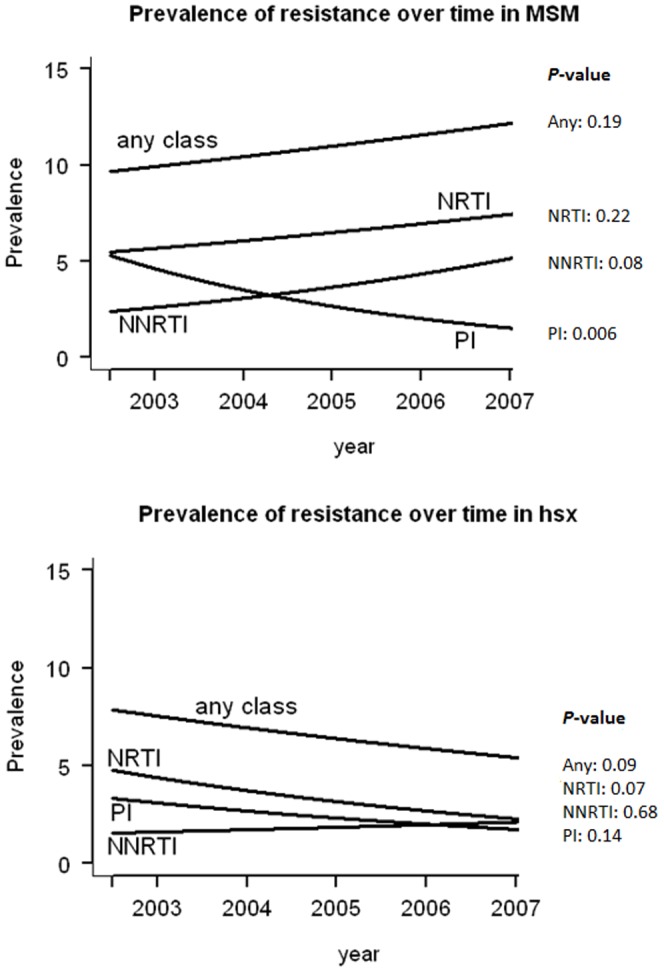
Prevalence of TDRM is shown for any of the drug classes (any class), nucleoside reverse transcriptase inhibitor (NRTI), non-nucleoside reverse transcriptase inhibitor (NNRTI) and protease inhibitor (PI) in (A) Men having sex with men (MSM), and in (B) heterosexuals (HSX). The p-values of the time trends are shown on the right side of the graph.