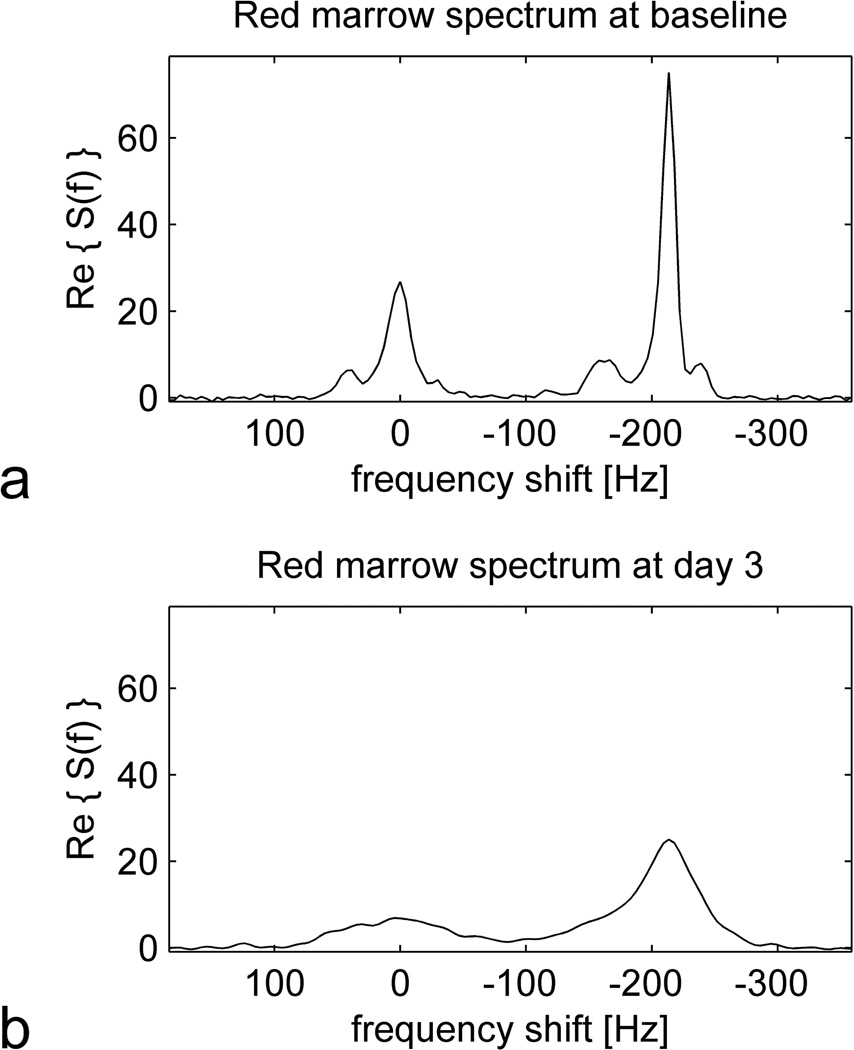
Figure 2.
Spectra from red marrow in the proximal right diaphysis of a 41 year old man at baseline (a) and 3 days after ferumoxytol administration (b). As in Figure 1, the spectra were obtained from the MGRE signal by performing a Fourier transform over the echo dimension, and data from several adjacent voxels were combined to improve SNR. Note that the baseline spectrum (a) resembles the reference fat spectrum (Figure 1b) with the addition of a peak at 0 Hz frequency shift corresponding to water. Both the lipid and water peaks are broadened in response to ferumoxytol administration (b), reflecting a shortening of (increase in ).

