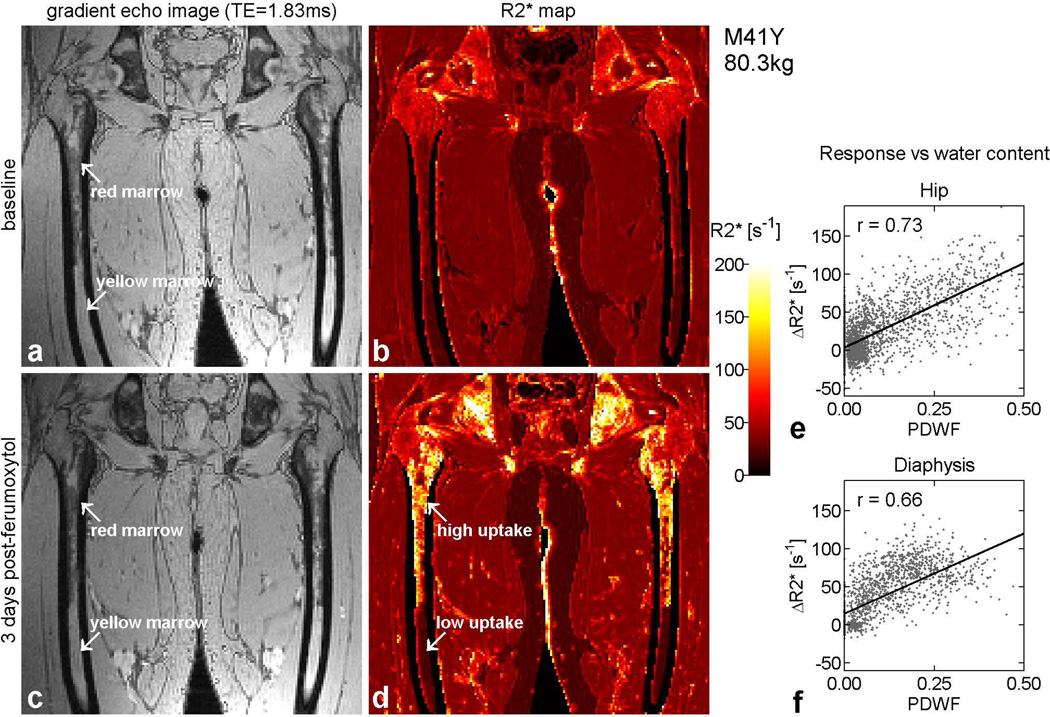
Figure 3.
Gradient echo images and maps from the same subject as in Figure 2, illustrating regional variations in the response to ferumoxytol. Panels (a) and (b) show results from baseline, while panels (c) and (d) are from day 3. On the left are raw images reconstructed from the first echo of the MGRE acquisition, with TE = 1.83 ms. Due to the relative phases of fat and water at this echo time, red marrow appears relatively dark while yellow marrow is brighter. Panels (b) and (d) show the corresponding maps, which are displayed using the adjacent color scale. Regions such as background and cortical bone, where the signal was too low to fit, are displayed in black. Between baseline and day 3, increases dramatically in red marrow but remains low in yellow marrow (arrows). Detailed inspection shows that the enhancement pattern on the post-contrast map (d) closely matches the anatomic distribution of red marrow on the gradient echo image (c). The slight geometric distortion, responsible for the ‘bow-legged’ appearance of the femora in panels (a) – (d), is due to the fact that the images were reconstructed offline, without access to information concerning the nonlinearity of the imaging gradients. The graphs on the right depict the response to ferumoxytol in each voxel as a function of proton density water fraction (PDWF), both in the hip (e) and the diaphysis (f).

