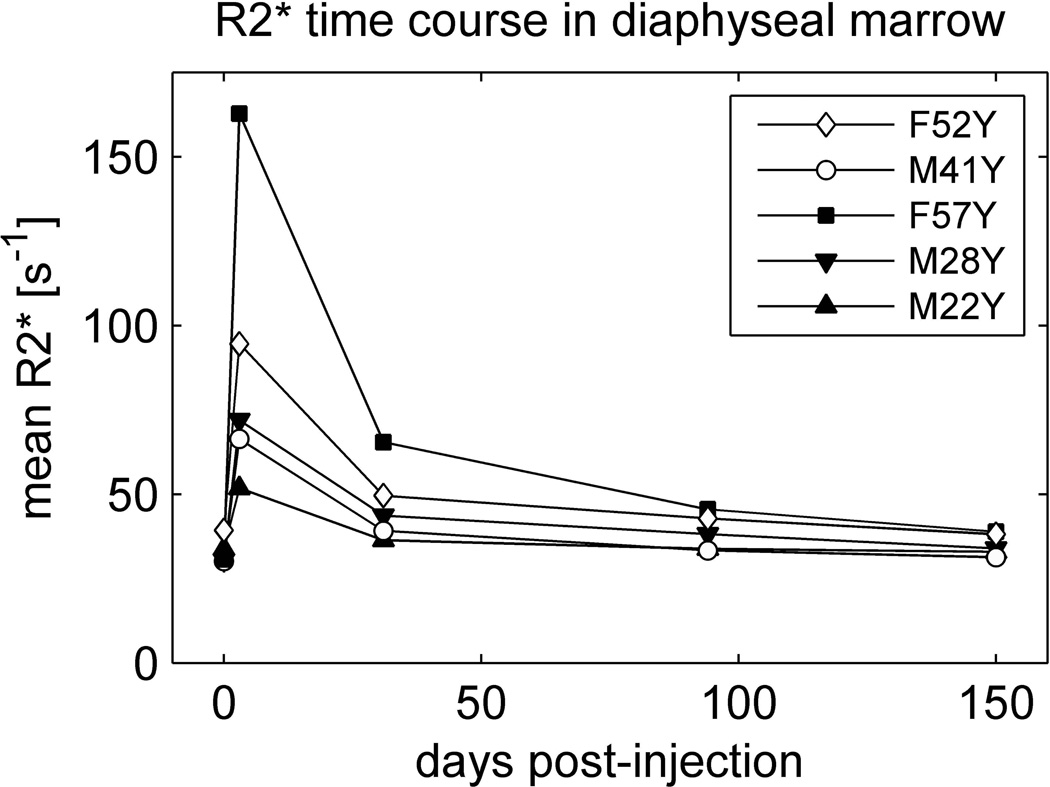
Figure 5.
Mean in diaphyseal marrow as a function of time over the entire 5-month period of the study. Baseline values are plotted at day zero. is averaged over all marrow voxels in the proximal 18cm of the diaphyses regardless of their water content. PDWF for each subject is provided in Table 1.

