
Figure 3. The relative expression level of BTK1, BTK2 and BTK3.
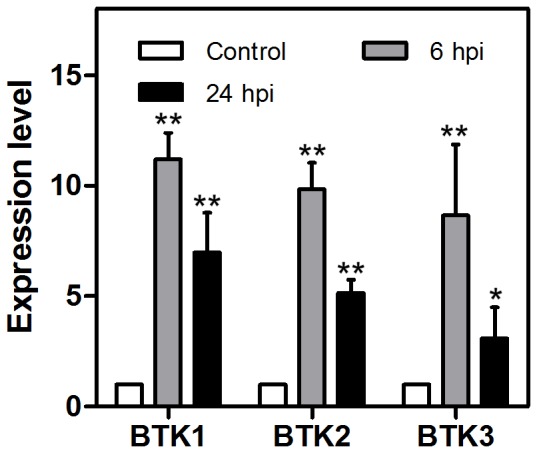
The expression level of these genes in uninfected whiteflies was set to 1 (white). Grey and black represent 6 hpi and 24 hpi respectively. Statistical significance compared with Control of P≤0.05 (*) and P≤0.001 (**), Student's t test. Error bars: ±SE of the mean.