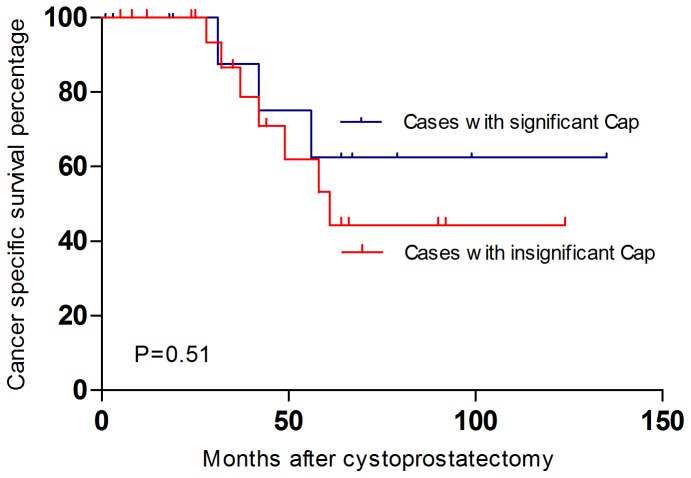
Figure 1. The Kaplan-Meier curves of cancer specific survival (including the urothelial carcinoma and the adenocarcinoma of the prostate) after radical cystoprostatectomy.
The blue curve indicated the cancer specific survival of the cases with concomitant significant prostate cancer while the red curve showed the cancer specific survival of the cases with insignificant prostate cancer. There was no statistical significance identified between the 2 groups. (P = 0.51)

