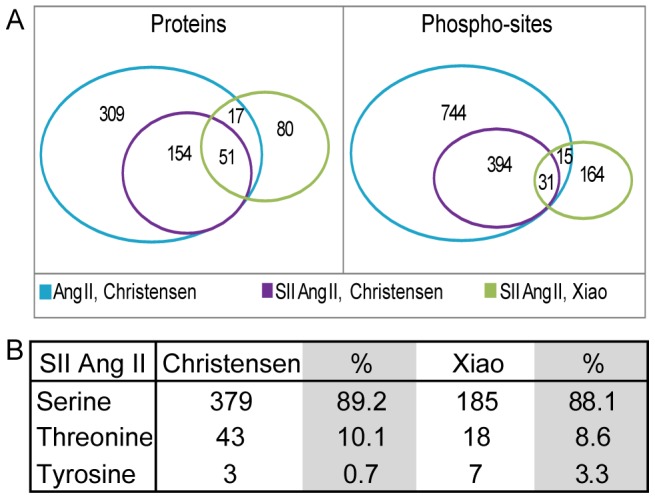
Figure 2. Comparison of the up-regulated proteins and phosphosites detected in the two MS studies.

The IPI IDs of the dataset from Xiao and co-workers was mapped to UniProt, and the two ID lists were compared by an in-house script. A) Comparison of the two SII Ang II regulated data sets revealed surprisingly little overlap in phosphosites, only 5%. On the protein level the overlap was merely 17%. The figure also shows that 15 phosphosites detected to be regulated only with Ang II in the Christensen study was regulated with SII Ang II in the study by Xiao and co-workers. Of these 15 phosphosites, 5 were more than 1.4 fold regulated, and was included as SII Ang II regulated in the analysis. B) The distribution of Ser, Tyr and Thr sites in the two studies.
