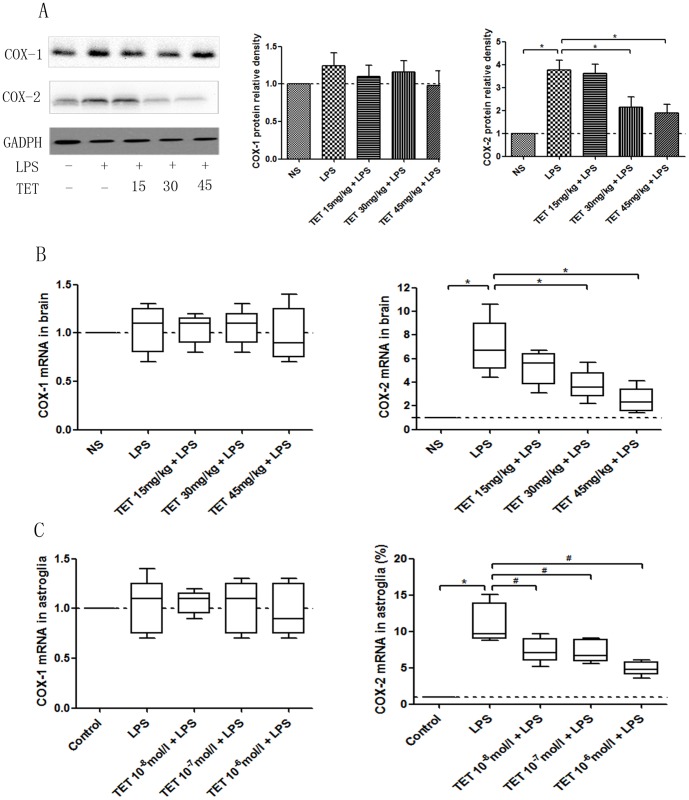
Figure 3. Repressive effects of TET on the expression of COX-1 and COX-2 in LPS-induced hyperalgesia.
(A) Western blotting of COX-1 and COX-2 in brain tissues and the quantified comparison of relative densities are shown. (B) COX-1 and COX-2 mRNA expression were tested by qRT-PCR in brain tissues. (C) COX-1 and COX-2 mRNA expression were tested by qRT-PCR in cultured astroglia. Values are shown as M±SD, and normalized to the NS groups. *, P<0.05.

