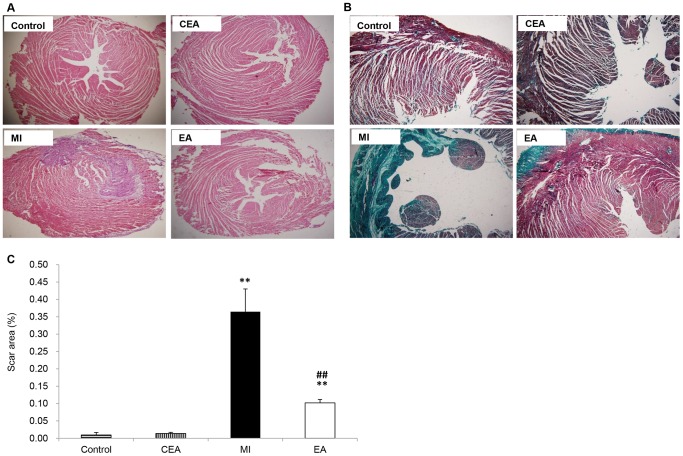
Figure 3. Evaluation of myocardial remodeling.
A. Representative image of hematoxylin and eosin (H&E) staining of each group. B. Representative image of Masson's trichrome staining of each group, scale bar, 100 µm. C. Relative quantification of scar size. Data were showed as means ± SD, n = 5, *P<0.01 vs. Control, # P<0.01vs MI.

