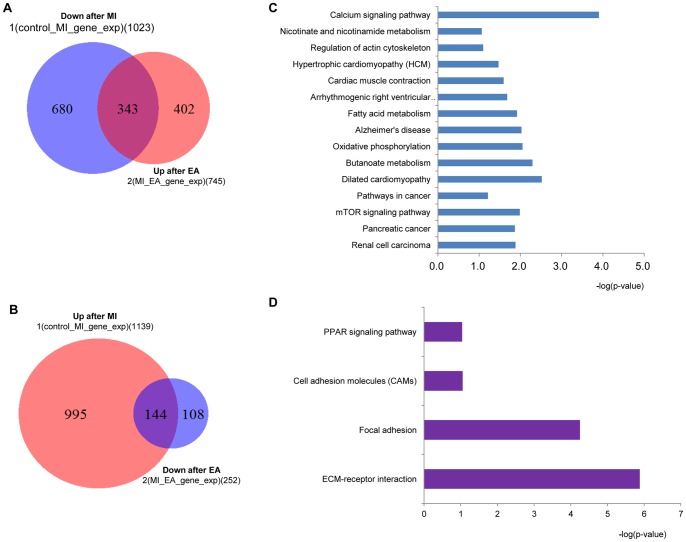
Figure 4. Genome-wide association study results.
At the end of EA treatment for 7 days, the total RNA was extracted from the harvested hearts for RNA-Seq analysis. A and B, Venn diagrams of regulated gene numbers by MI and EA treatment. A. Overlapped area represents increased gene number (343) in EA group but decreased in MI group; B. Overlapped area represents decreased gene number (144) in EA group but increased in MI group. C. The top 15 pathways of these genes involved in the 343 genes in A; D. Major pathways of the 144 genes shown in B.

