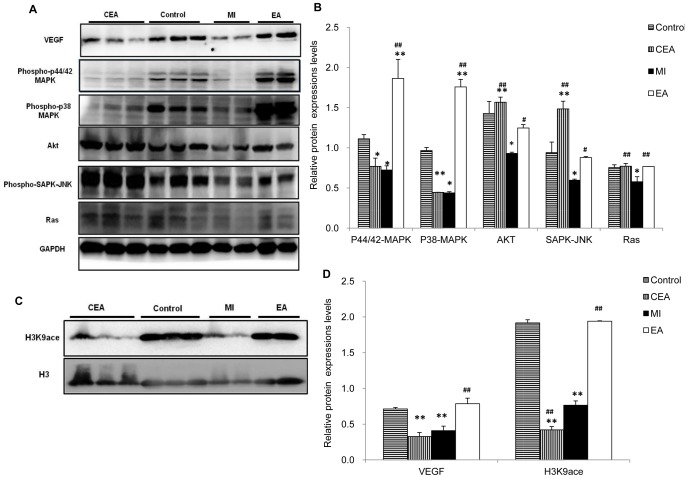
Figure 6. Detection of protein expressions related to VEGF-induced angiogenesis and H3K9 acetylation level.
A and C. Representative western blot results of VEGF signaling proteins and H3K9ace in each group. B and D. Quantitative analysis of VEGF signaling proteins and H3K9 ace. Data were showed as means ± SD (n = 4∼6), *P<0.05, **P<0.01 vs. Control, # P<0.05, # # P<0.01 vs. MI.

