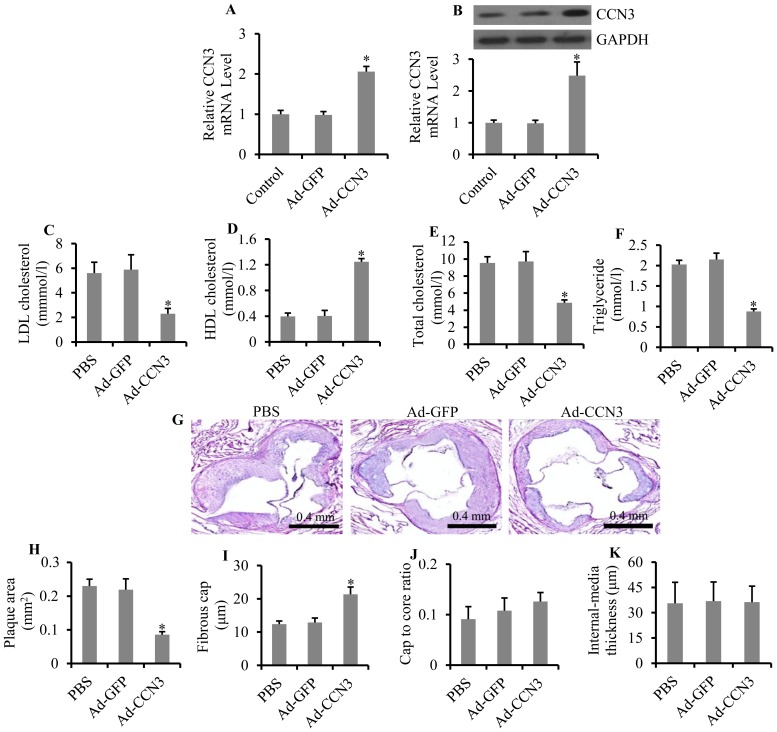
Figure 3. Effect of overexpression of CCN3 on atherosclerosis.
CCN3 mRNA (A) and protein (B) levels in different treatment groups of mice were analyzed by qRT-PCR and Western blot, respectively. PBS, mice injected with PBS as a control; Ad-GFP, mice injected with recombinant adenovirus expressing GFP as a non-specific control; Ad-CCN3, mice injected with recombinant adenovirus expressing CCN3. Serum levels of LDL cholesterol (C), HDL cholesterol (D), total cholesterol (E), and triglycerides (F) in the three groups of mice are shown. Cross-section histological analyses of plaques stained by HE (G) are shown. Quantitative analysis of plaque area (H), fibrous cap (I), cap-to-core ratio (J), and intima-media thickness (K) in the three groups of mice are also shown. *p<0.05 vs. PBS or Ad-GFP denotes a statistically significant difference.

