
Figure 2. Age-related incidence in FTD and AD.
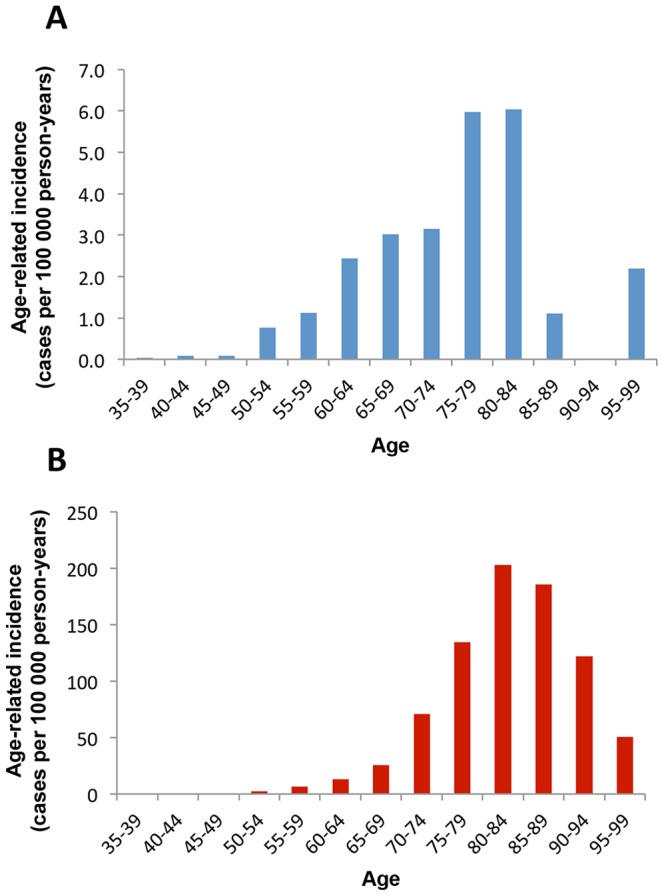
The figures show the incidence of FTD (A; blue bars) and AD (B; red bars) in relation to age (years). Values for incidence are given as cases per 100 000 person-years in each 5 year age cohort.
Official websites use .gov
A
.gov website belongs to an official
government organization in the United States.
Secure .gov websites use HTTPS
A lock (
) or https:// means you've safely
connected to the .gov website. Share sensitive
information only on official, secure websites.
The figures show the incidence of FTD (A; blue bars) and AD (B; red bars) in relation to age (years). Values for incidence are given as cases per 100 000 person-years in each 5 year age cohort.