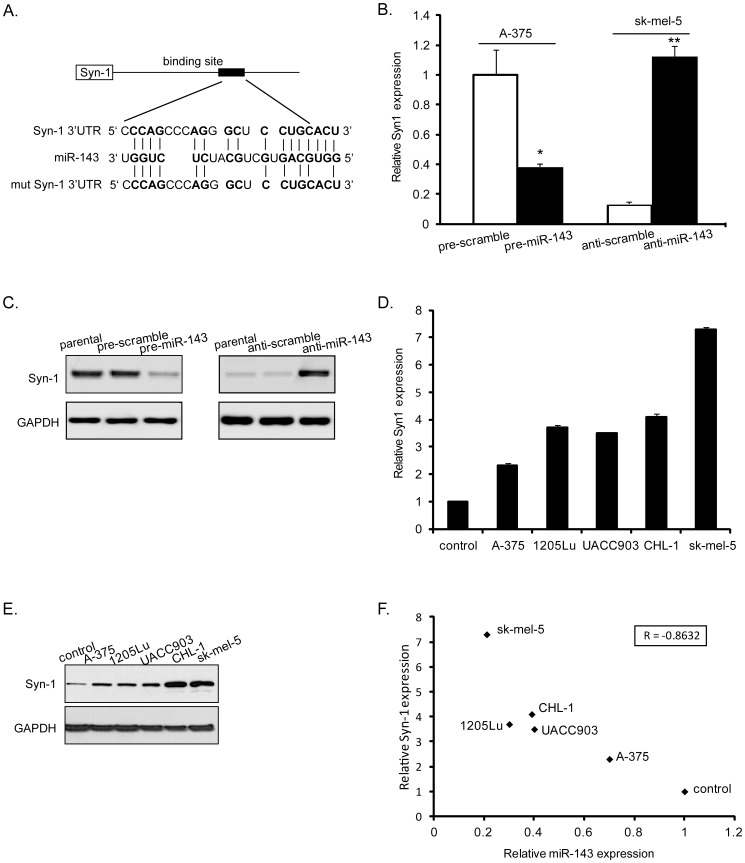
Figure 3. Negative correlation between miR-143 and Syn-1.
(A) The predicted miR-143 binding site within Syn-1 3′UTR and its mutated version by site mutagenesis are as shown. (B, C) Upregulated expression of miR-143 inhibited Syn-1 expression at both mRNA and protein level, while reduction of miR-143 restored Syn-1 expression. (D, E) Variable Syn-1 expression in five melanoma cells and normal control skin tissues pooled from 3 healthy individuals. GAPDH was used as the loading control. (F) An inverse correlation was observed in five melanoma cells (Spearman's correlation, R = −0.8632). (**P<0.01, *P<0.05, Figure is representative of 3 experiments with similar results.)

