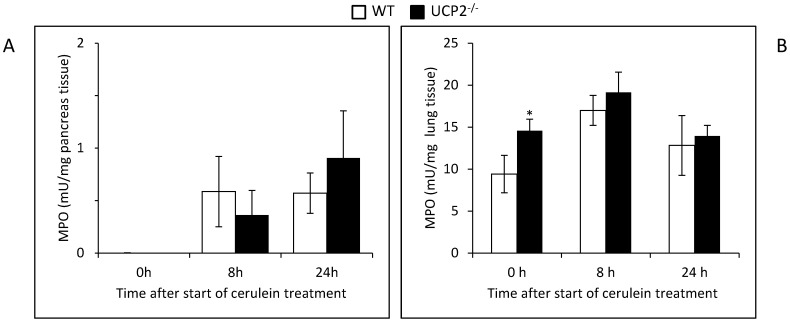
Figure 10. MPO activities in pancreatic and lung tissue of cerulein-treated WT and UCP2-/- mice.
Tissue samples (A, pancreas; B, lung) of 12 months old mice at the indicated time points after initiation of cerulein treatment (n = 8 per group) were subjected to the quantification of MPO activity as described in the “Materials and methods” section. Data are expressed as mU/mg wet weight (mean ± SEM). *P<0.05 (WT versus corresponding UCP2-/- mice).

