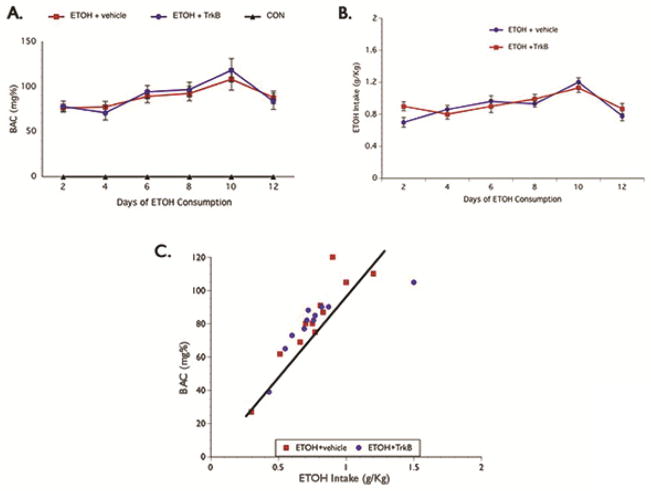
Figure 2. BAC Level.
Alcohol was administered in a binge-like pattern for 12 days and BAC was determined every other day. Both BAC (A) and alcohol intake (B) was not significantly different between the ETOH groups; and the increased BAC seen correspond with alcohol consumption as seen in the scatterplot illustrating a single day of drinking session (C). BAC – blood alcohol concentration.

