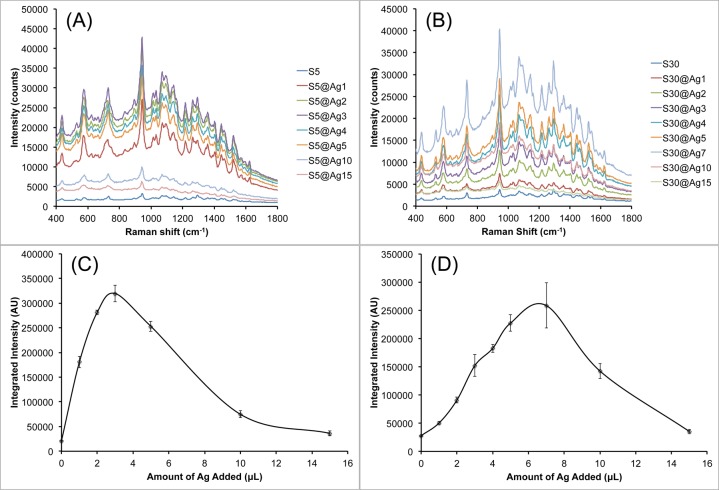
Figure 6.
SERRS measurement of S5@Ag (A, C) and S30@Ag (B, D) with various amounts of silver coating, labeled with IR-780. Raw SERRS spectra for S5@Ag (A) and S30@Ag (B) are shown. Spline chart of the background-subtracted integrated signal intensity at 730 cm–1 for S5@Ag (C) and S30@Ag (D) samples. Error bars are ±1 standard deviation (n = 3). All spectra were recorded with a 100 ms exposure time using a 785 nm laser (150 mW power at the sample).

