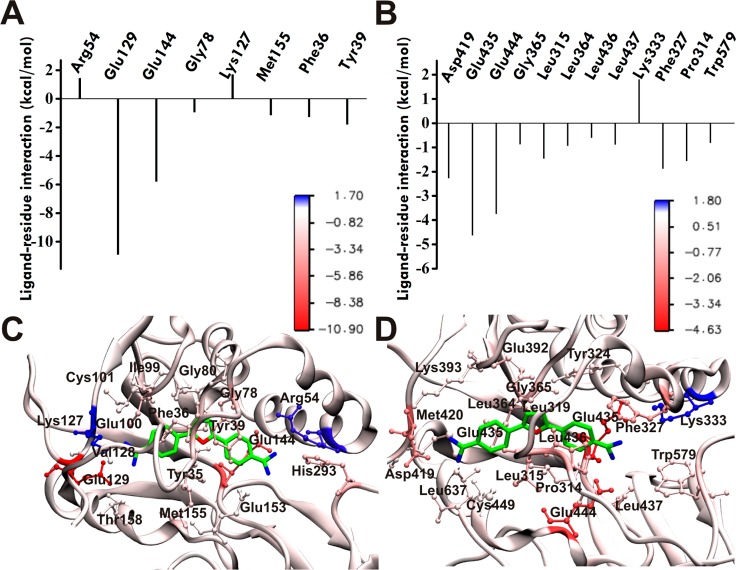
Figure 4.
Predicted binding modes of compound 1 in PRMT1 and PRMT5 from docking (AutoDock 4.2) and molecular dynamics simulation (NAMD 2.8). Ligand–residue interaction energies from MM/PBSA energy decomposition for (A) PRMT1 and (B) PRMT5. (C, D) Binding modes of compound 1 with (C) PRMT1 and (D) PRMT5. The best docking pose obtained from AutoDock for 1 in complex with the hPRMT1 homology model (based on 1F3L(44) and 3SMQ(45)) and X-ray hPRMT5 (4GQB53) was selected for MD simulation. Dominant structures for the hPRMT1·1 and hPRMT5·1 complexes from the last 20 ns of MD trajectory clustering analysis were used for visualization. PRMT residues engaging the ligand are explicitly shown in ball and stick representation. The protein (in cartoon representation) is colored according to the residue contribution values in the free energy decomposition from red (negative) to blue (positive).

