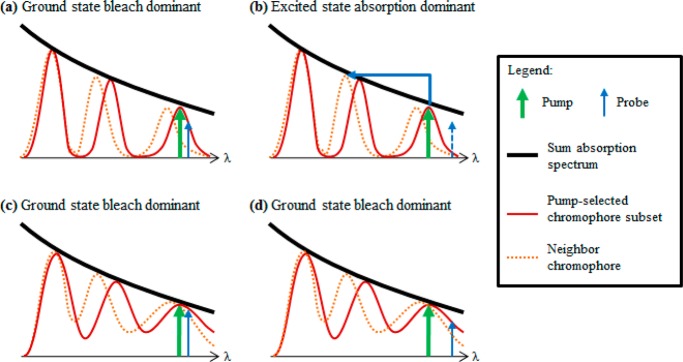
Figure 12.

Schematic diagram showing the proposed explanation of the connection between λpu,x and the individual oligomer absorption spectrum. The black curve represents the broad melanin absorption spectrum composed of the sum of individual oligomer absorption spectra. The red peaks represent the absorption spectrum of an individual oligomer unit. The blue arrow represents the pump pulse. The green arrow represents the probe pulse. The dotted orange lines represent the absorption spectra of a neighboring chromophore.
