
Figure 4.
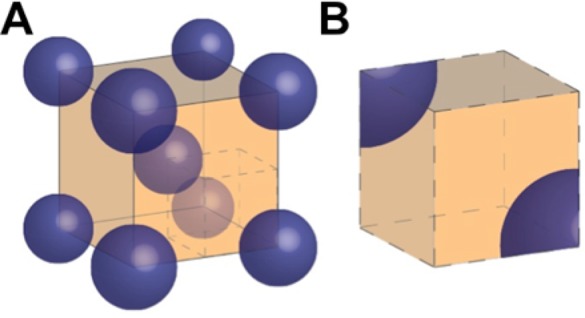
Illustration of the geometry used in modeling. (A) For a 1:4 PEG:citrate volume ratio, PEG-rich phase droplets (blue) are within the continuous citrate-rich phase (orange). (B) The computational domain of the mathematical model is a subsection of part A.