
Figure 6.
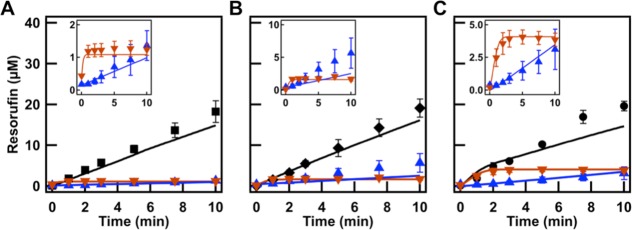
PEG:citrate volume ratios (A) 4:1, (B) 1:1, and (C) 1:4 with 10× more HRP. Model predictions were applied to experimental ATPS volume ratios (black traces) and prepartitioned assays in separated PEG-rich phase (blue triangles) and citrate-rich phase (orange triangles). Insets highlight the phase-separated controls.