
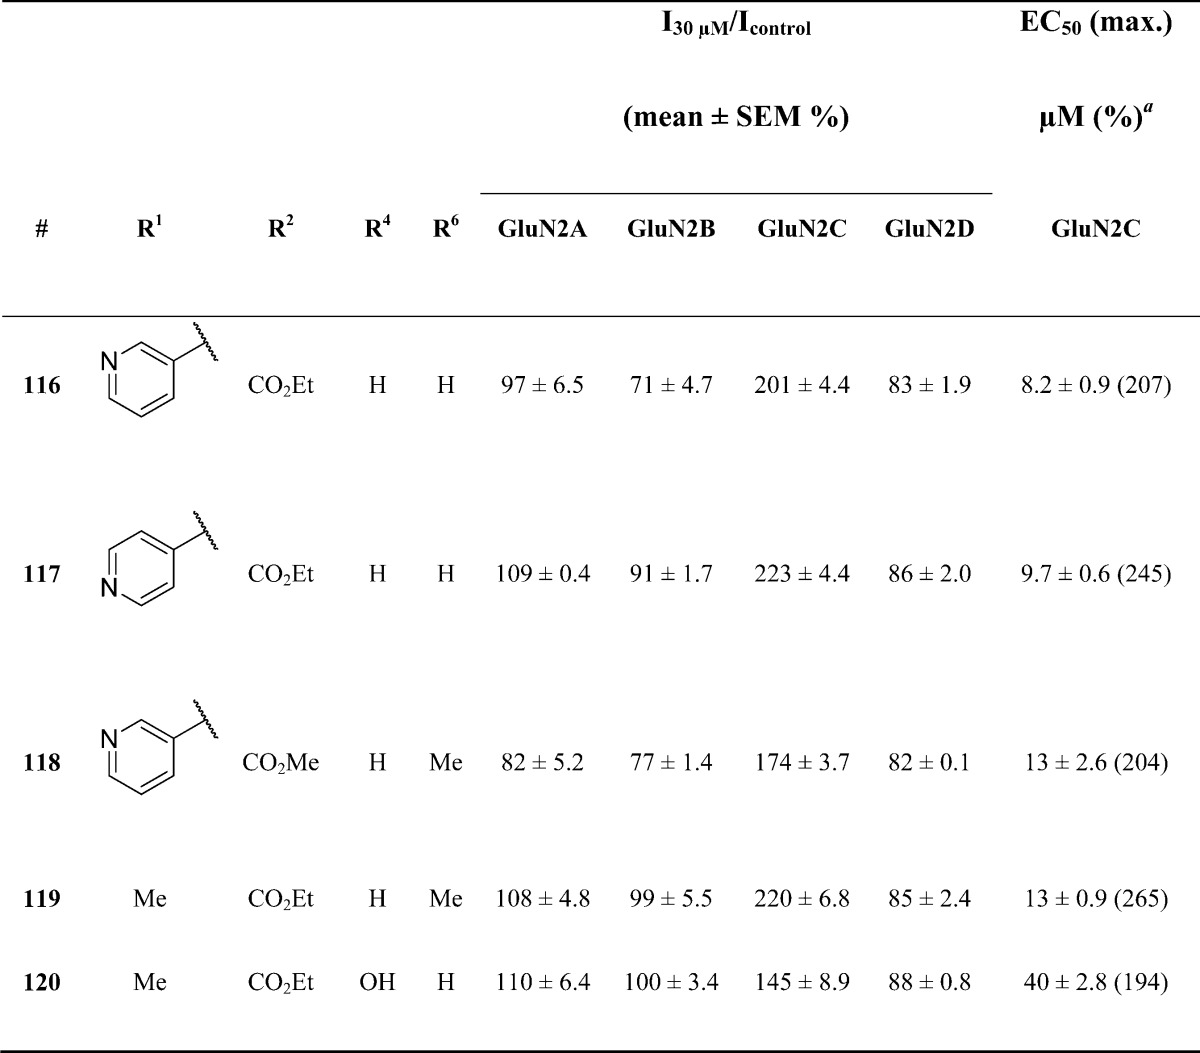
Table 6. Optimization of Potency though Additional Modifications.
a
Fitted EC50 values are shown for GluN1/GluN2C to two significant digits when potentiation at 30 μM of the test compound exceeded 120% of control; values in parentheses are the fitted maximum response as a percentage of the initial glutamate (100 μM) and glycine (30 μM) response. Data for active compounds at GluN1/GluN2C are from between 8 and 14 oocytes from 2 frogs for each compound; the Hill slope varied between 1.2 and 1.5. When no effect was found at 30 μM (n = 3–6 oocytes), the lack of effect was confirmed by testing at 100 μM (data not shown, n ≥ 7 oocytes for all compounds).