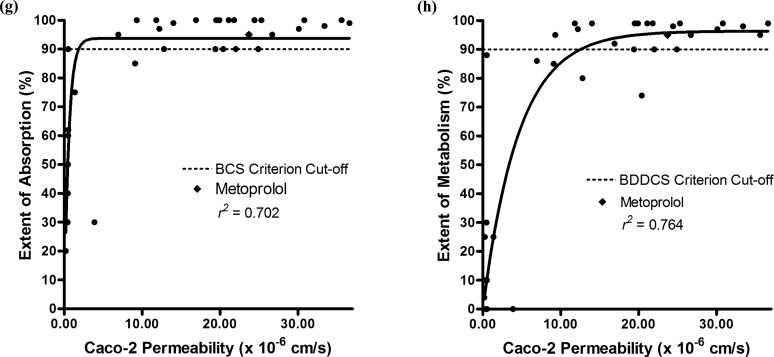
Figure 2.
Comparison of BCS and BDDCS classifications with Caco-2 permeability rate measures. Correlation plots of the extents of absorption (a) and metabolism (b) with Caco-2 permeability rate data from Alsenz and Haenel.27 Correlation plots of the extents of absorption (c) and metabolism (d) with Caco-2 permeability rate data from Irvine et al.28 Correlation plots of the extents of absorption (e) and metabolism (f) with Caco-2 permeability rate data from Li et al.29 Correlation plots of the extents of absorption (g) and metabolism (h) with Caco-2 permeability rate data from Yazdanian et al.30 The solid line represents the best fit of the nonlinear regression.


