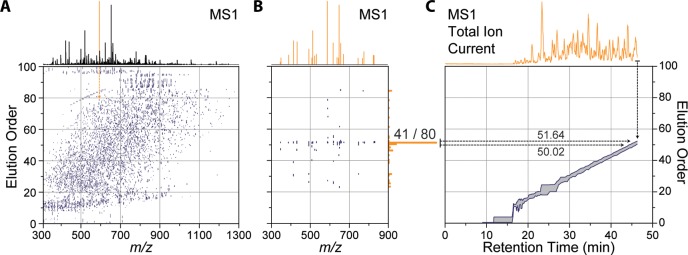
Figure 3.

Real-time elution order alignment algorithm. 46.3 min into a nano-LC–MS/MS experiment, an MS1 scan is performed (A) and m/z features are matched to a 2D ion map stored on the instrument. (B) 21 of the peaks match 80 features in the ion map at a 10 ppm tolerance. Of these, over half (41 of 80) were mapped to one elution order bin (51 elution order). (C) A rolling elution order range is continually updated throughout the nano-LC–MS/MS experiment.
