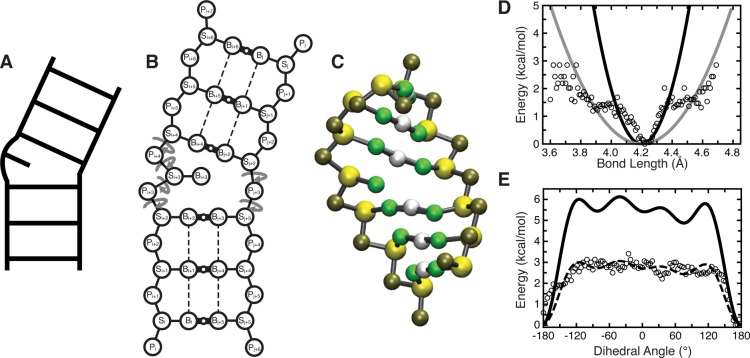
Figure 1.
Outline of the TOPRNA model. (A, B, C) A secondary structure element is shown according to its ladder cartoon, and in 2D and 3D TOPRNA representations. In part B, circular arrows denote freely rotatable bonds, thick solid lines with small open circles denote permanent base pair bonds with an accompanying “M” filler pseudoatom, and dashed lines denote improper dihedral angles used to maintain helical twist. (D) The adenine Pi–Si bond potential is shown as a representative harmonic potential. Black and gray lines indicate the different potentials used for base-paired and single-stranded nucleotides, respectively, following the observation that these bonds exhibited strong and weak harmonic potential behavior at short and large deviations. Two different potentials were also used for angles involving this bond, but other bonds and angles were assigned the same K regardless of base-pairing status. (E) The Si–Pi+1–Si+1–Pi+2 dihedral potential placed between sequentially paired residues i and i + 1 is shown as a representative example. The dashed line indicates the original cosine series fit to the statistical potential, with the solid line indicating the final TOPRNA potential after the K’s obtained from the original fit were uniformly doubled. Statistical potentials were calculated by binning every 0.01 Å and 3.6° for bonds and dihedrals, respectively, with unpopulated bins excluded, and are shown using open circles in parts D and E.

