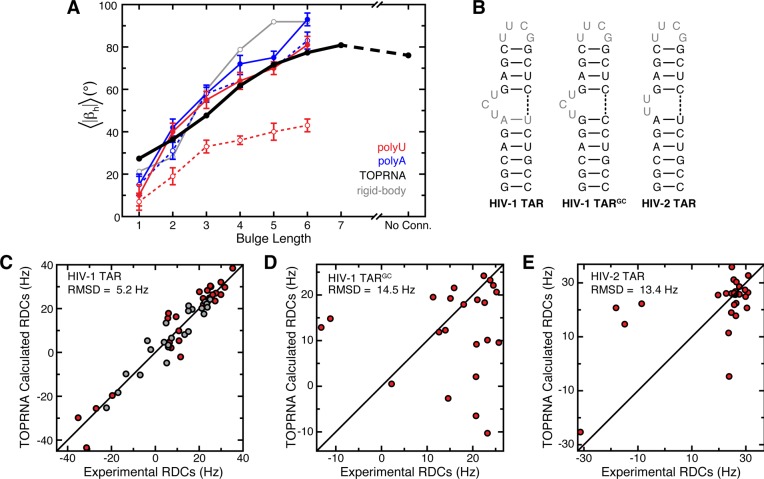
Figure 5.
Ensemble averages over TOPRNA bulge simulations reproduce experimentally measured properties of bulge motifs. (A) |βh| averaged over TOPRNA simulations (black) and over the ref (29) predicted allowed spaces (gray) for different bulge motifs is plotted next to the bend angles measured by transient electronic birefringence for polyU (red) and polyA (blue) bulges in the absence (solid line, filled circles) and presence (dashed line, open circles) of Mg2+.61 Error bars denote experimental error.61 “No conn.” denotes a bulge-like junction that lacks connectivity in its bulge strand. (B) HIV-1 TAR, HIV-1 TARGC, and HIV-2 TAR secondary structures. RDCs from nucleotides shown in gray were excluded from the RDC analysis. (C, D, E) HIV-1 TAR, HIV-1 TARGC, and HIV-2 TAR experimental RDCs versus values computed from either 3-nt or 2-nt TOPRNA bulge simulations.56,57 In part C, red and gray points correspond to RDCs from helix I and helix II TAR elongations, respectively.56 N–H bond vectors were excluded from all RDC analysis.

