
Figure 6.
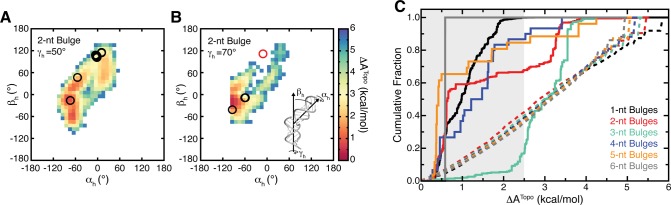
Bulge conformations found in the PDB are consistent with the TOPRNA free-energy landscape. (A, B) Representative 2D slices of the 2-nt bulge free energy landscape (T = 300 K) are shown for constant γh = 50° (A) and γh = 70° (B). Open circles denote conformations observed in the PDB, with the red circle in part B highlighting the 4ERD outlier. The inset in part B is a cartoon illustrating the physical meaning of the (αh, βh, γh) angles. (C) Cumulative distribution functions showing the fraction of (αh, βh, γh) conformations with ΔATopo less than a given cutoff value. The distributions for (αh, βh, γh) conformations observed in the PDB are shown as solid lines. The distributions for (αh, βh, γh) in the TOPRNA topologically allowed spaces are shown as dashed lines. The gray background highlights ΔATopo values <2.5 kcal/mol. 1853, 705, 347, 30, 26, and 1 structures are represented by the PDB curves of 1-nt, 2-nt, 3-nt, 4-nt, 5-nt, and 6-nt bulges, respectively.