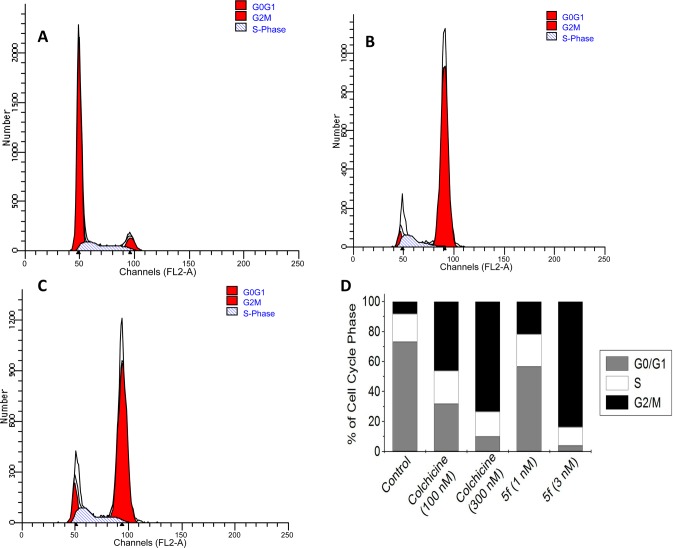
Figure 2.
Cell cycle analysis was performed using a FACSCalibur (BD Biosciences) after treatment of A549 cells with 5f and analysis by a standard propidium iodide procedure as described in the Experimental Section. (A) DMSO-treated (0.1%) cells served as a control. (B, C) A549 cells were harvested after treatment with 5f (3nM, B) or colchicine (300 nM, C). (D) Cell cycle contributions resulting from treatment with 5f (1 and 3 nM) or colchicine (100 and 300 nM) for 24 h.

