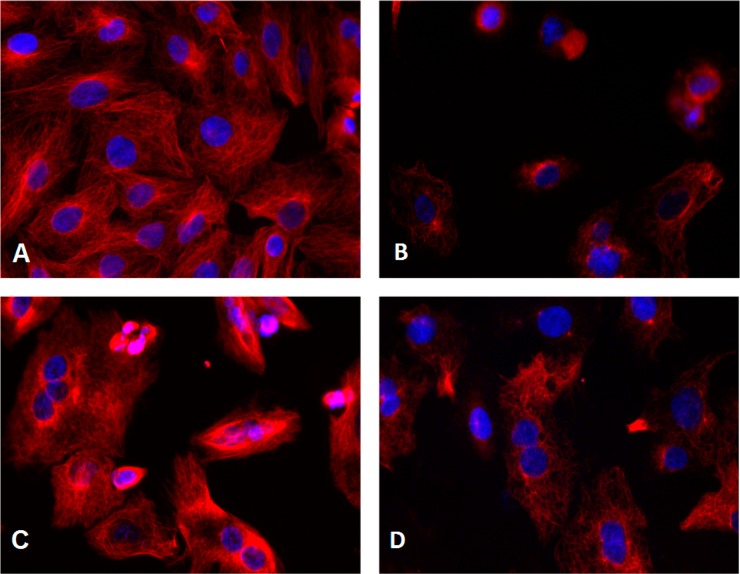
Figure 3.
Effects of tested compounds on microtubules. A549 cells were treated with (A) 0.1% DMSO, (B) 5f (3 nM), (C) paclitaxel (100 nM), or (D) colchicine (100 nM) for 24 h. Microtubules were visualized with an anti-α-tubulin antibody (red), and the cell nucleus was visualized with Hoechst 33342 (blue). Images were acquired with an Incell Analyzer 1000 using a 20× objective.

