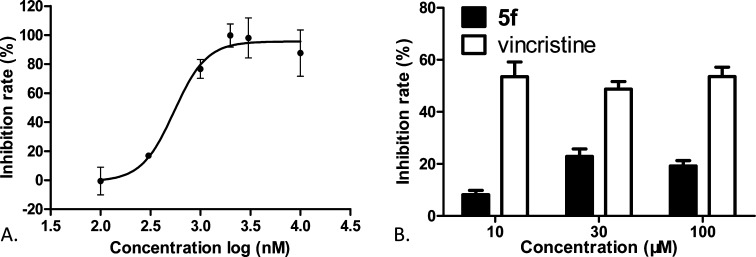
Figure 4.
(A) Compound 5f bound tubulin at the colchicine site. The inhibition curve of 5f competing with colchicine–tubulin was plotted as inhibition rate vs concentration. The inhibition rates were expressed as the percentage (%) of decreased fluorescence of the tubulin–colchicine complex. An IC50 value of 0.55 ± 0.09 μM was determined using GraphPad Prism V5.01. (B) Compound 5f did not compete for the vinblastine site. Compound 5f or vincristine at the indicated concentrations competed with BODIPY FL-vinblastine to tubulin. The reduction in the fluorescence intensity of tubulin–BODIPY FL-vinblastine complex was measured and converted into inhibition rates. All results were expressed as the mean ± SD of at least three independent experiments.

