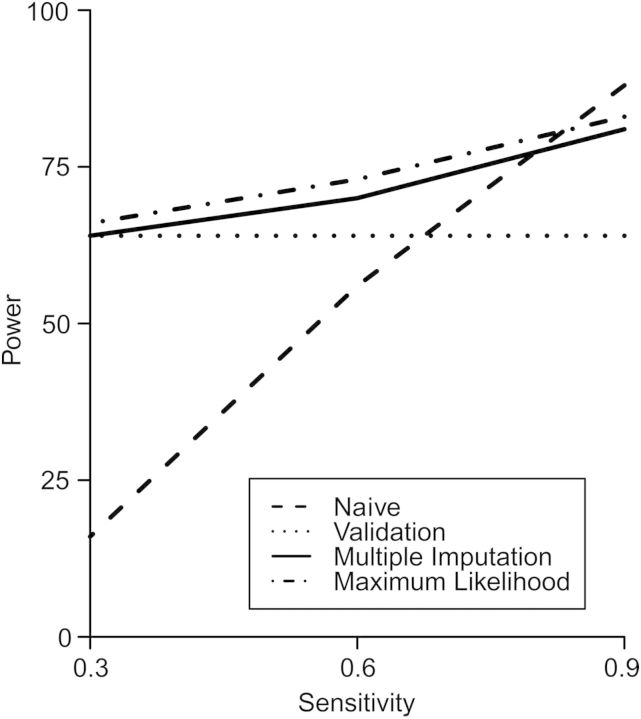
Figure 1.
Relationship between statistical power and sensitivity of the observed outcome measure in simulations with a 30% validation subgroup and a total sample size of 1,000 for the naive analysis, analysis limited to the validation subgroup, analysis using the direct maximum likelihood method, and analysis using the multiple-imputation method to account for outcome misclassification.

