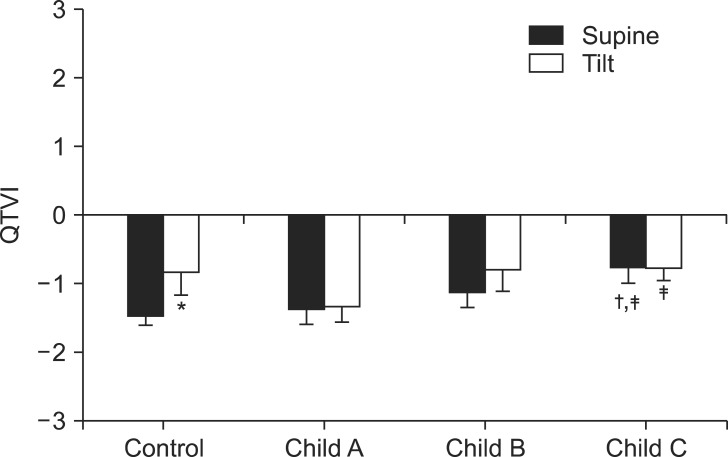
Fig. 1.
Change in QTVI (QT variability index) in the supine and head-up tilt (HUT) positions in control and end-stage liver disease patients. QTVI significantly increases according to severity of the end-stage liver disease. QTVI significantly increases after HUT in the control group. *P < 0.05 vs. supine position, †P < 0.05 vs. control subjects, ‡P < 0.05 vs. Child class A patients.

