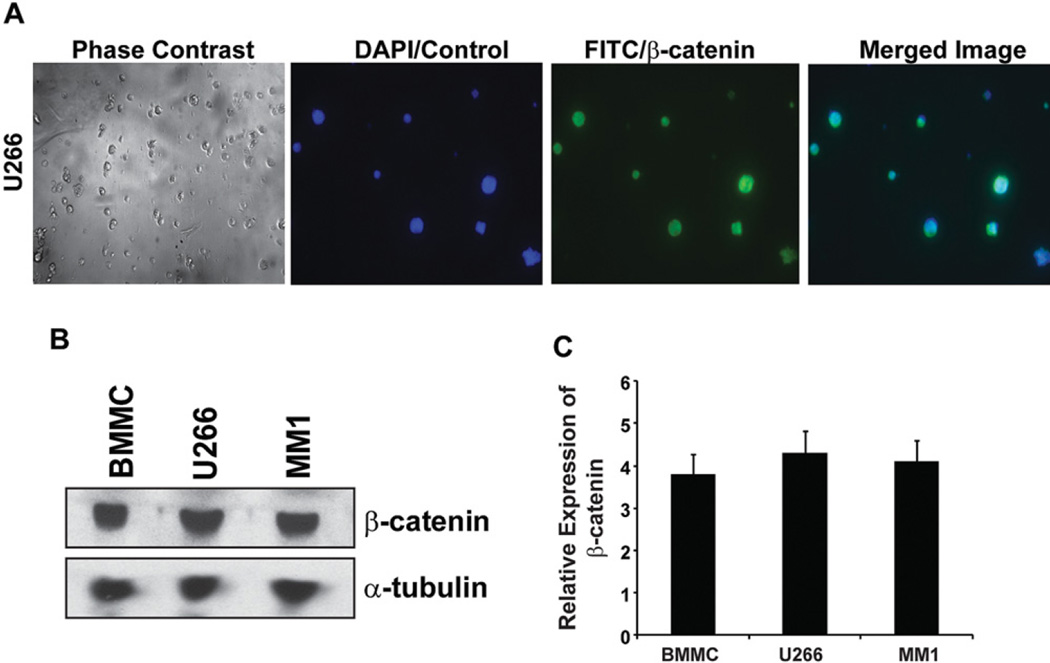
Figure 1.
β-catenin expression in MM. (A) Immunofluorescence detection of nuclear β-cat in the cytospin preparation of U266 cells. Approximately 5000 cells/slide were fixed in 10% NBF, followed by staining for β-cat and counter staining with DAPI to label the nuclei as described in the Methods. (B) Immunoblotting of total β-cat expression in MM and BMMC cell lysates. Western blot analysis using the respective protein lysate (30 µg/lane) was performed as described in the methods. Antibody for α-tubulin was used as loading control. (C) Bar graph represents the relative mean pixel density of the reactive protein bands of β-cat with reference to the loading control a-tubulin from three independent blots. The data presented in each bar represents mean±SD.

