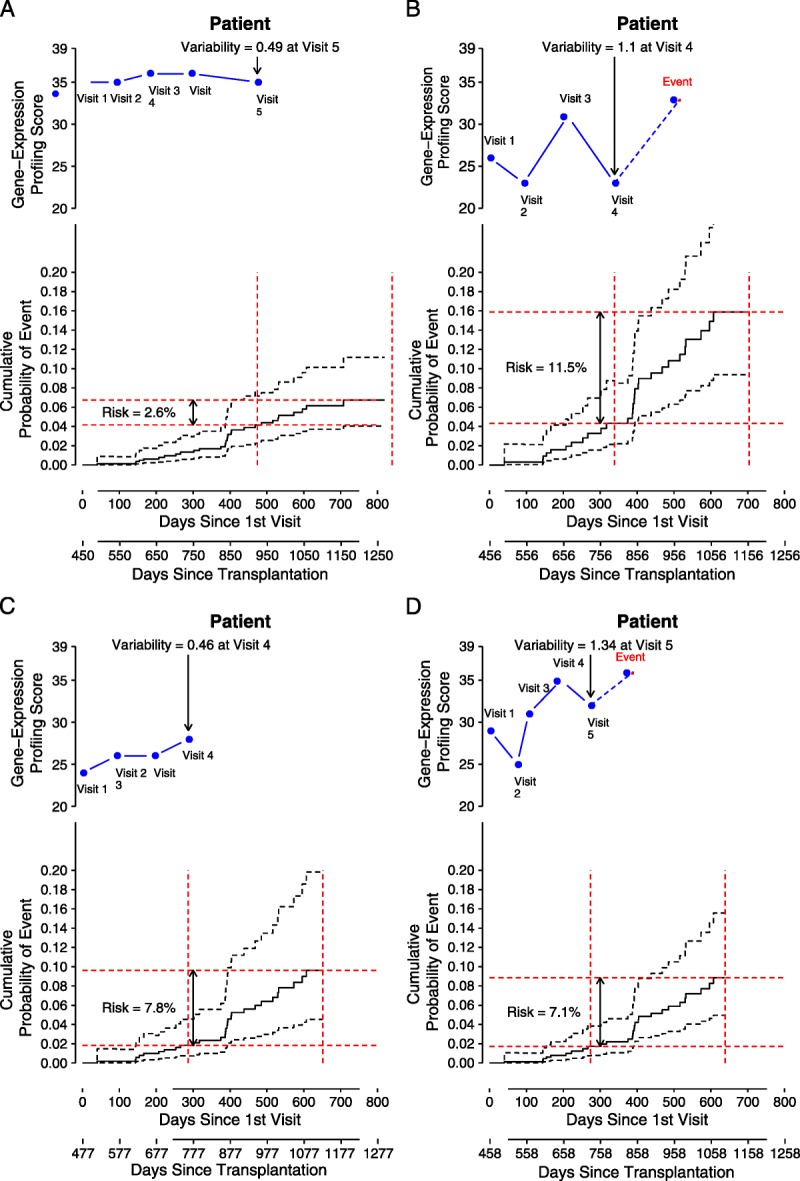
FIGURE 1.

Examples of using gene expression profiling test score variability to predict future clinical events*. In each panel, the top inset graph shows the longitudinal visits and associated gene expression profiling ordinal test scores (the time of the first surveillance gene expression profiling test is treated as day 0). The index visit number and the associated variability score is indicated with the arrow. In the lower inset in each panel, the “probability of event” is plotted, along with 95% CI (dashed lines). The risk (e.g., 2.6%) of an event in the next 12 months for the patient is shown with the red lines.
