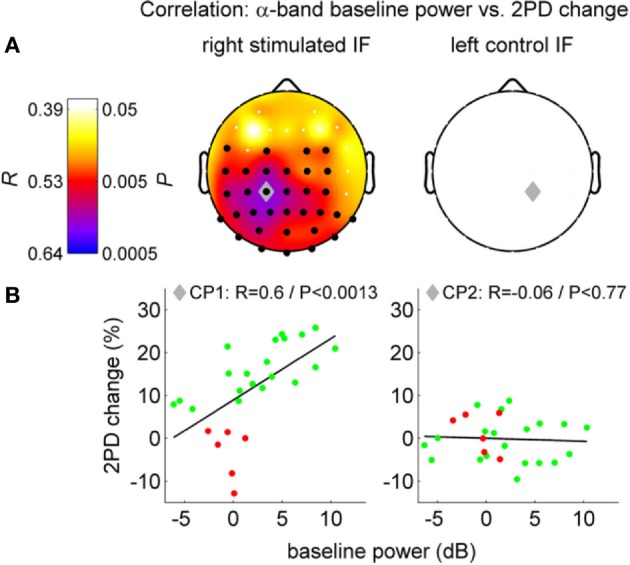
Figure 6.

Correlation between two-point discrimination (2PD) change and alpha band resting-state EEG power before perceptual learning (left column: stimulated side, i.e., right finger; right column: control side). (A) Top row, scalp distributions with Pearson's correlations coefficients (R and P-values). Black dots: significant cluster of channels. Gray diamond: maximum correlation. (B) Scatter plot, single subject values at channels CP1/CP2 (green: successful learners, red: bad learners). Figure adapted with permission from Freyer et al. (2013).
