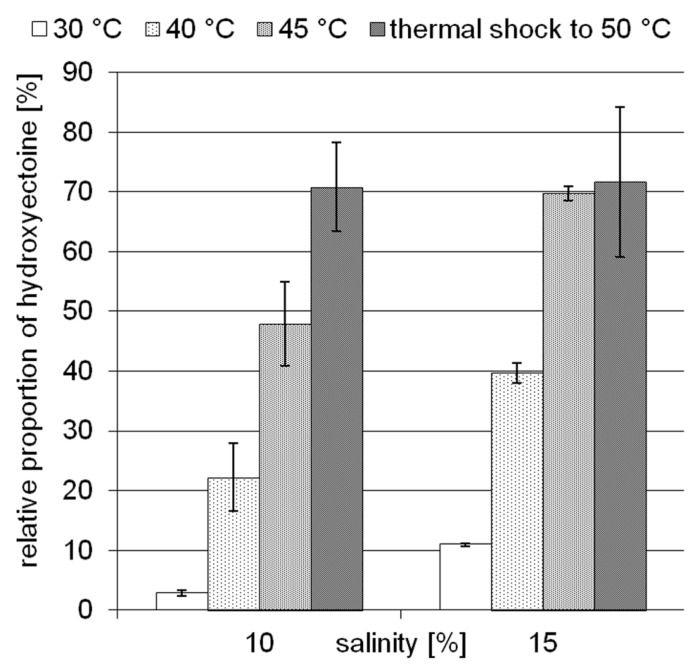
FIGURE 2.
Influence of temperature and salinity on the relative proportion of hydroxyectoine in H. elongata. Error bars represents lowest and highest value of duplicate measurements for both salinities at 30°C and for 15% NaCl at 45°C; all others represent standard deviations of three replicates (in the case of 15% NaCl, upshock) or at least four replicates.

