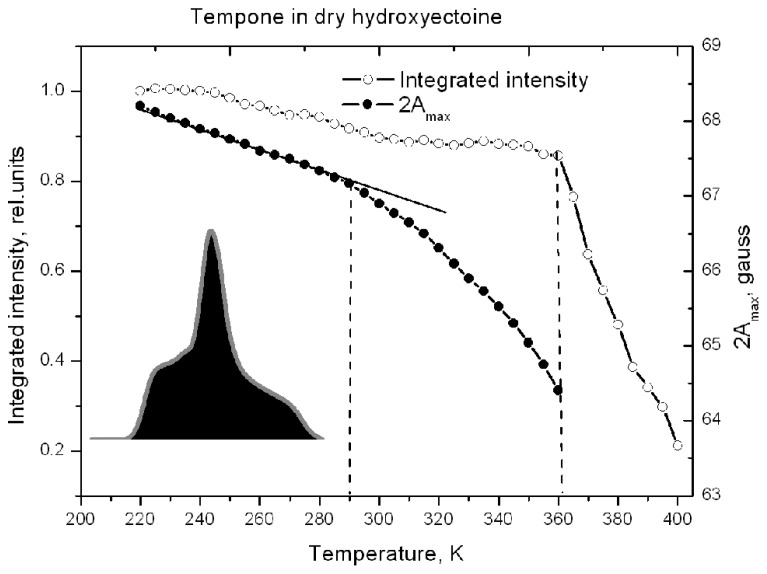
FIGURE 8.
Temperature dependence of the distance between outermost extremes 2Amax (as in Figure 7) and the relative spectral integrated intensity (normalized to the intensity at 220 K) of the ESR spectra of Tempone in dry hydroxyectoine. Inset – first integral of ESR spectrum (absorption) at 220 K. The integrated intensity is the area (black) under the absorption peak (gray).

