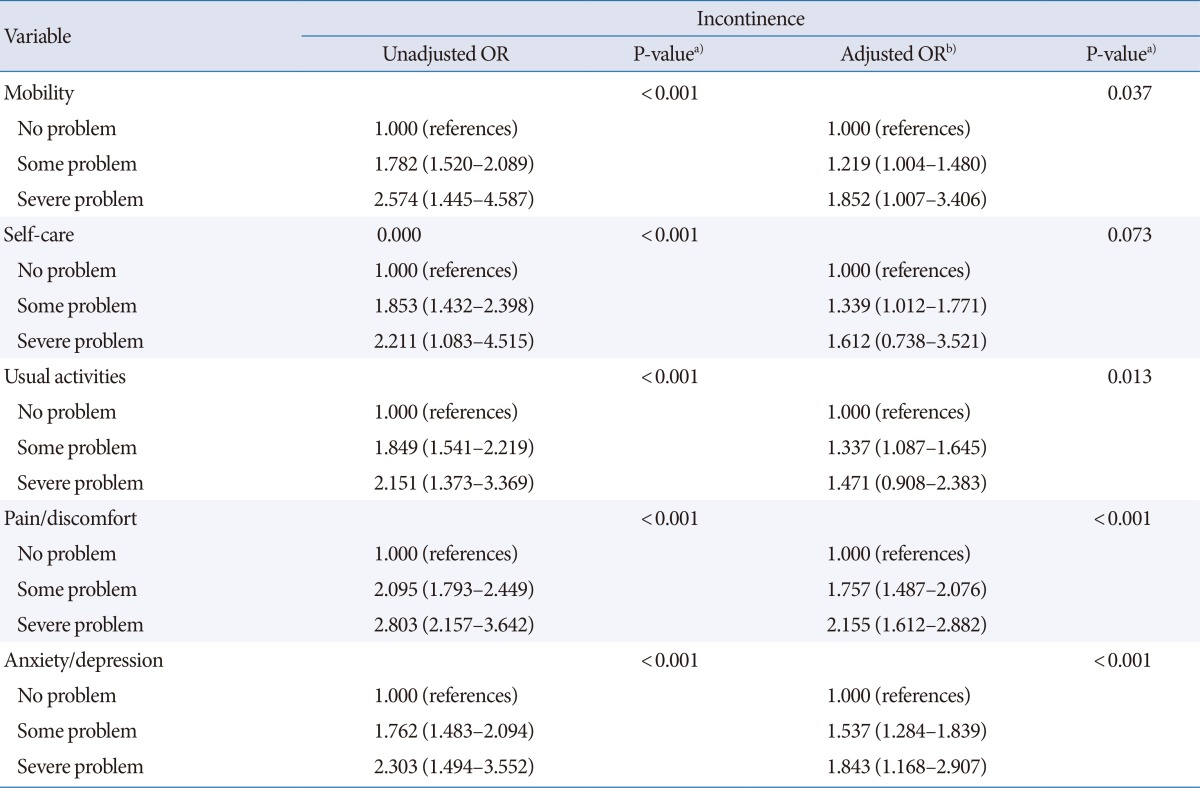
Table 3.
Relationships between incontinence and quality of life assessed by EQ-5D

EQ-5D, EuroQol-5 dimension; OR, odds ratio; CI, confidence interval.
a)Logistic regression analyses. b)Adjusting for age, body mass index, home income, education, hypertension, diabetes, stroke, marital status, and place of residence.
