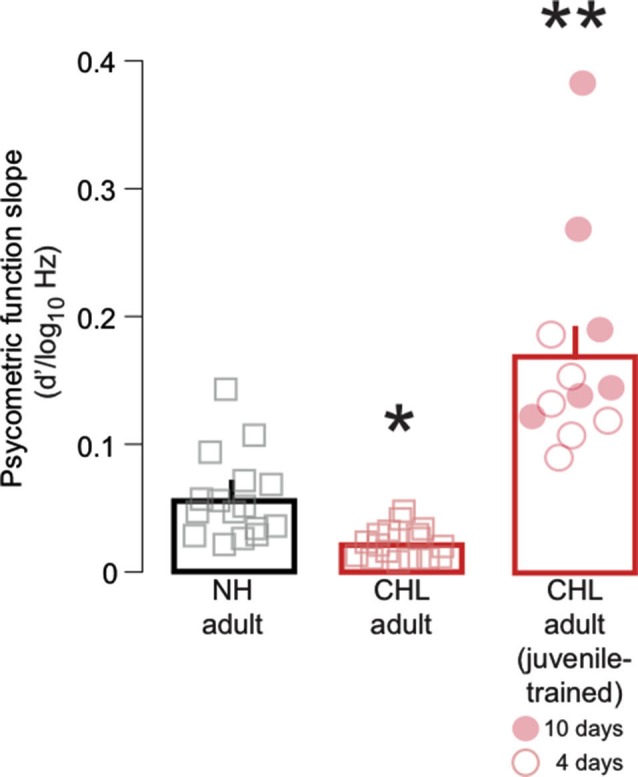
Figure 3.

Training on FM detection as a juvenile improved psychometric function slopes in adulthood. Average slope of fitted psychometric functions (d′/log10Hz; mean ± SEM) are plotted for NH adult (black bar, gray squares), CHL adult (red bar; red squares), and CHL adult animals trained on the FM task as juveniles (red bar; red circles). Data points from individual animals are the average of the best 3 days of performance. For the trained animals, open circles indicate 4 days of perceptual training, and closed circles indicate 10 days of perceptual training. Significant differences for between-group comparisons are presented in the text and indicated here by asterisks (** significantly greater than all other groups; * significantly smaller than all other groups).
