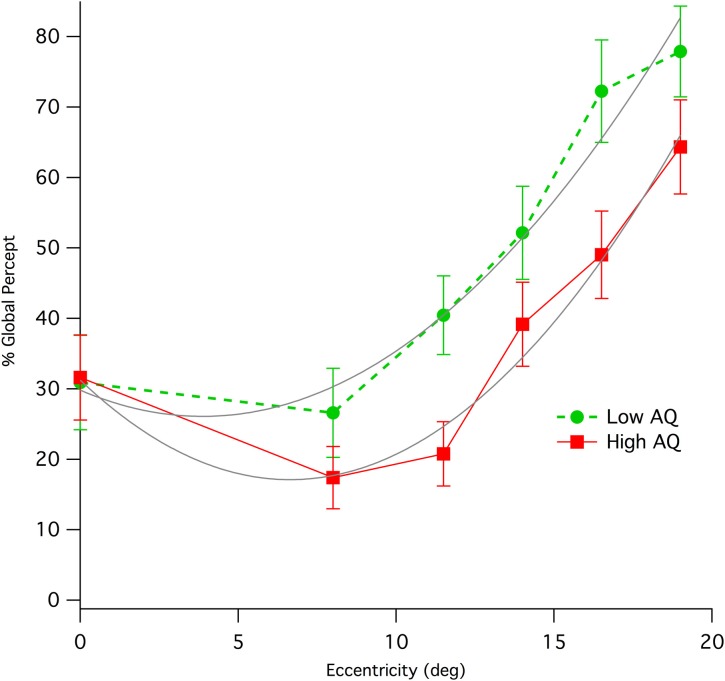
Figure 3.
Means (with standard error) of percentage of initial global percept for Low and High AQ groups when viewing the stimulus at various eccentricities in visual field. The data for High AQ are shown with a solid red line, while those for the Low AQ group are shown as a dashed green line. Parabolic fits (gray color) to the two sets of data allow a comparison of relative eccentricities required to give equivalence of global percept between the High AQ and Low AQ groups.

