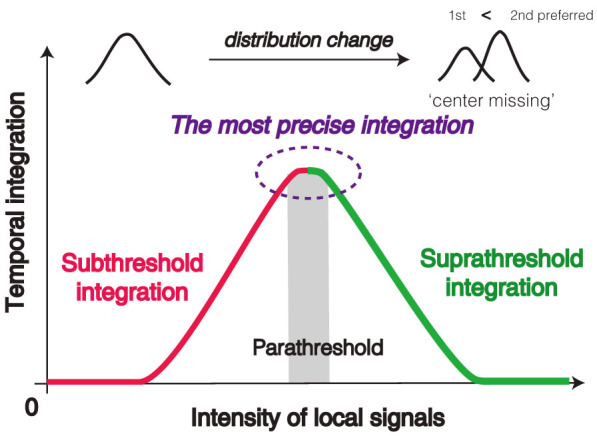
Figure 4. Schematic illustration of the hypothesized relationship between temporal-integration and intensity of local signal.

Subthreshold integration (red) and suprathreshold integration (green). The most precise temporal-integration (purple dotted circle) occurs when the local signals are subthreshold or parathreshold, because perception of suprathreshold signals that are presented more recently is too strong to allow integration, which also might make the probability distribution consist of a combination of two distributions, ‘center missing’.
