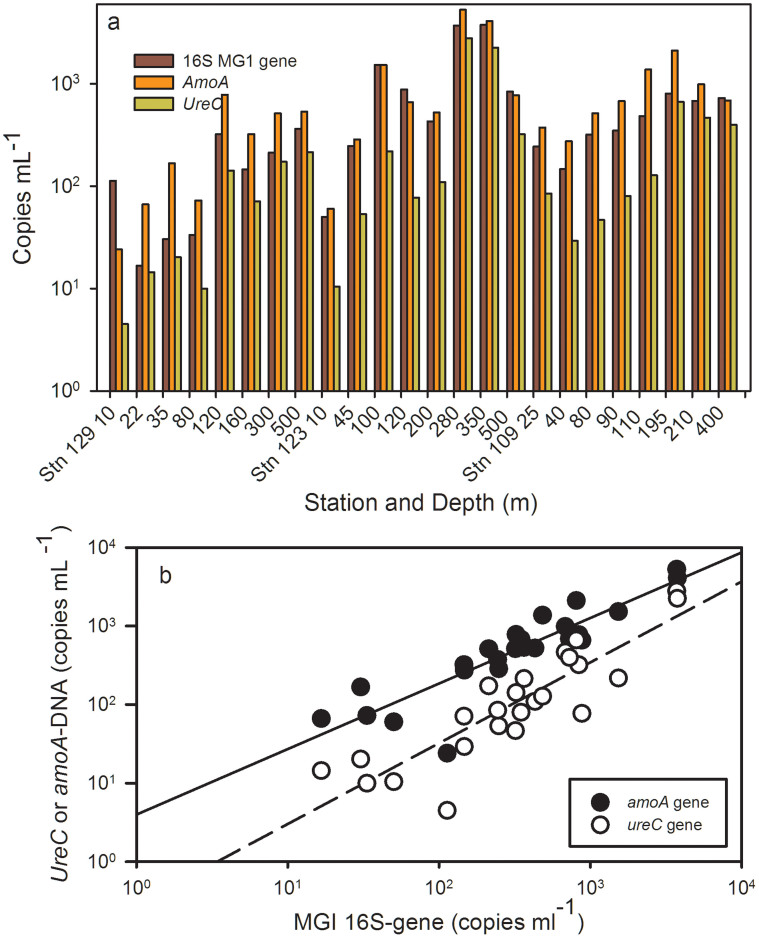
Figure 5.
Panel (a) Northern Baffin Bay, qPCR copies mL−1 of MGI, amoA and ureC genes (DNA template). Station number and depth of sampling are indicated along the X axis. Panel (b) Log-log plots of gene copies of ureC (open circles) and amoA (closed circles) compared the 16S rRNA genes of MGI. Lines indicate significant linear regressions of the log transformed data; the dashed line is ureC versus MG1 (r2 = 0.76, p < 0.001), the solid line is amoA versus MGI (r2 = 0.78, p < 0.001). Standard errors of triplicates and standards were smaller than the size of the symbols.

