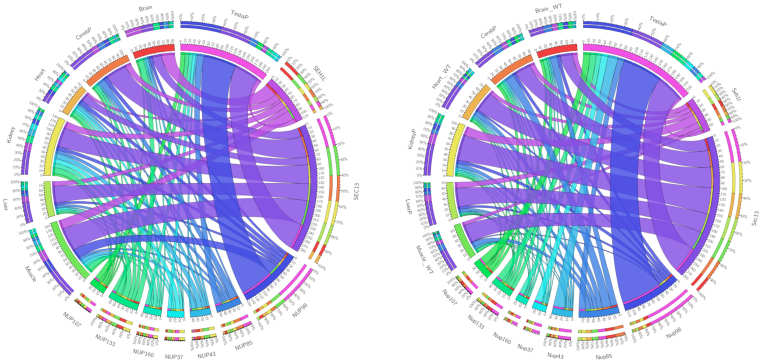
Figure 2. Gene expression patterns of Y-Nups in human (left) and mouse (right) across seven representative tissues based on RNA-seq profiles.
Circos Tableviewer (http://mkweb.bcgsc.ca/tableviewer/) representation as in Figure 1. Y-Nups are labeled by their gene names in the corresponding species (as in Figure 1, except NUP85/Nup85 equivalent to Nup75). Tissue labels are self-explanatory (WT signifying wild-type for mouse, -P signifying a single tissue sample). Note that SEC13 exhibits a much higher expression level than SEH1 possibly due to its participation in other macromolecular complexes. The full RNA-seq patterns across a wide range of tissues and cell lines (see Methods) are provided (Data Supplement DS10).

