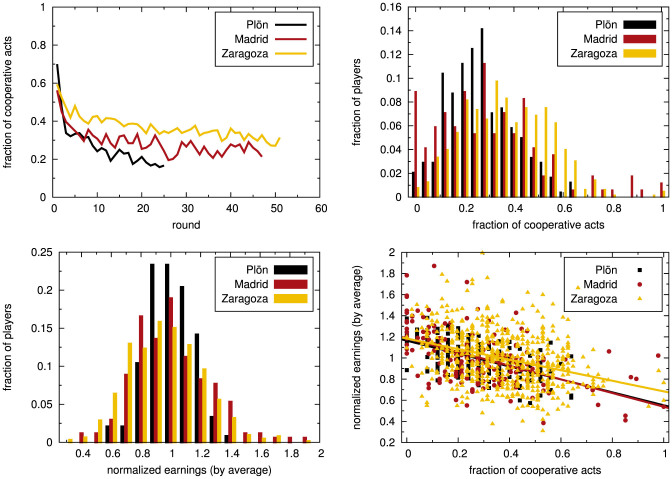
Figure 1. Main experimental results.
(Top left) Fraction of players who cooperated in each round. (Top right) Fraction of players who cooperated a given fraction of the rounds. (Bottom left) Fraction of players who earned a given amount, normalized by the average earning of all players in the same experiment. (Bottom right) Scatter-plot of earnings vs cooperativeness of the players. Each point represents one player, described by the fraction of rounds in which the player cooperates and the player's earnings normalized by the average earning of all the players. Slopes of the fits are following: Plön experiment s = −0.61, Madrid experiment s = −0.64 and Zaragoza experiment s = −0.50 (p < 0.001 in all cases).

