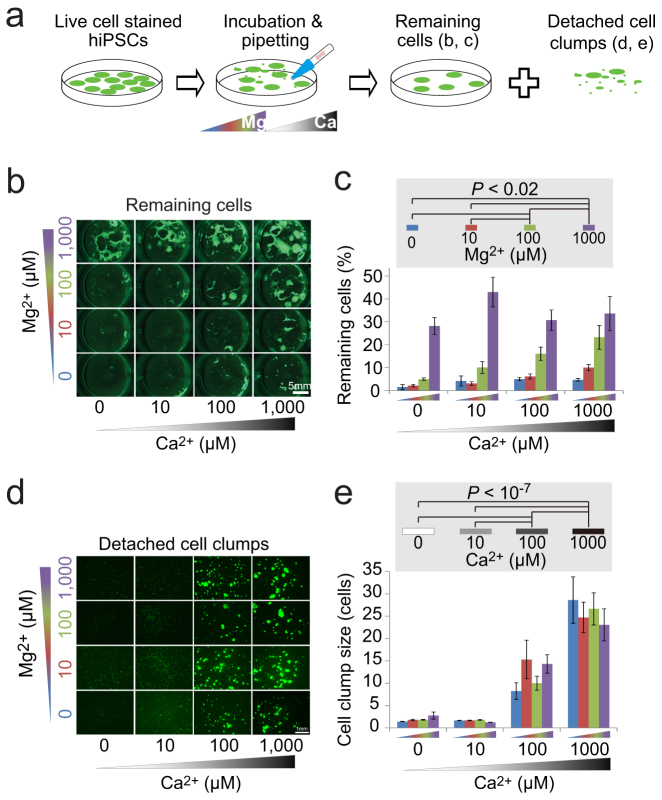
Figure 1. Dose-dependent effects of Mg2+ and Ca2+ on cell-fibronectin and cell-cell binding.
(a): Schematics of experiments. The illustrations were drawn by KO. (b–e): Fluorescent imaging (live-cell dye, Calcein-AM) of the hiPSCs (253G1) remaining on the fibronectin-coated 24-well plate (b) and the cells detached from the plate (d) after incubation and then trituration using a 1-ml pipette tip in PBS containing 0–1000 μM Ca2+ and Mg2+. (c): Remaining-cell ratios equal the area of remaining cells divided by the area of the cells before incubation and trituration. (d): Mean cell clump size detached from the plates. Two-way ANOVA revealed no interaction effect between Ca2+ and Mg2+ concentration ((c): P = 0.066, mean ± SE, n = 5, (e): P = 0.47, mean ± SE, n = 5 experiments × 200 cells). Post-hoc Tukey's multiple comparison revealed significant differences in remaining-cell ratio between different Mg2+ concentrations (the same Ca2+ data were put together to derive the numbers and bars in (c)) and in cell clump size between different Ca2+ concentrations (the same Ca2+ data were put together to derive the numbers and bars in (e)). Scale bars are 5 mm (b), 1 mm (d).

