
Figure 3.
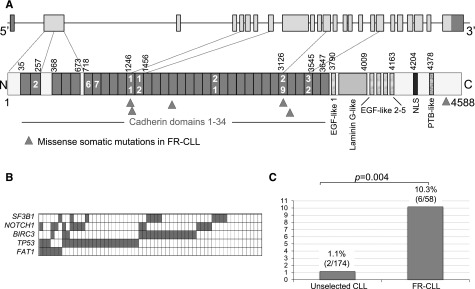
Features of FAT1 mutations. (A) Schematic representation of the FAT1 (upper) gene and (lower) protein, with its conserved functional domains. Triangles indicate the position of the mutations found in FR-CLL. (B) Mutual relationship of FAT1 mutations with other gene alterations in FR-CLL. In the heat map, rows correspond to identical genes and columns represent individual patients, color-coded based on the gene status (white indicates WT; gray indicates mutations and/or deletion of TP53, mutations and/or deletion of BIRC3, mutations of SF3B1, and mutations of NOTCH1). (C) Prevalence of FAT1 mutations in FR-CLL vs unselected CLL at diagnosis.