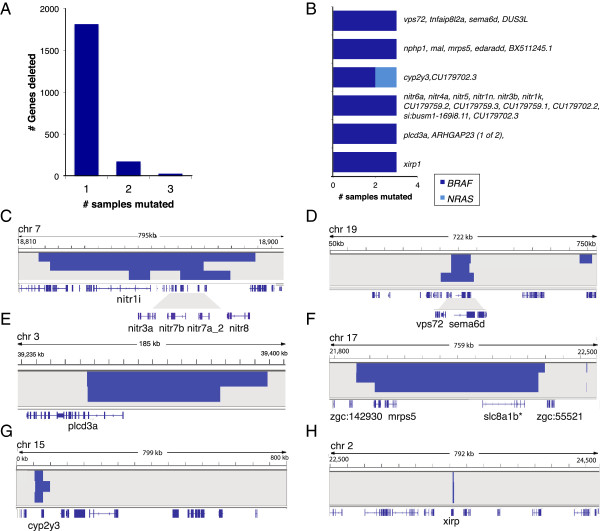
Figure 4.

Overview of homozygous deletions. (A) Frequency of homozygously deleted genes across samples. (B) Recurrently deleted loci occurring in at least three samples that are driven by BRAF (dark blue) or NRAS (light blue), and the corresponding genes in these regions (right-hand side). (C-H) Examples of deleted segments (dark blue bars) and the genes in these regions (labeled at the bottom), represented by their exon structures (dark blue lines).
